Early last week, I posted over 560 charts, each one representing the ICE detainee population at a detention facility in the United States. This is a follow up, a peek under-the-hood as to how I made the charts, elaborated over two parts.
First, I’ll explain why the detentions data released on The Deportation Data Project can be better understood as book ins data.
Second, I’ll outline how I converted the book ins data into detentions stint data and then finally to detention facility population numbers.
A Book Ins dataset
Many people want to know how often the government has carried out an immigration enforcement activity. How many arrests? How many detainers? How many deportations? This makes sense. Coming up with a total is a good first step in an analysis.
For arrests, detainers, and removals datasets, this is straightforward. Identify the appropriate date field, tally the unique records over a given time period, and you have yourself a metric of ICE activity. Arrests, detainers, and removals are discrete events that take place at particular points in time, and are therefore easier to immediately count when working with the case records.
But what about the detentions data? Following the above procedure, we would recognize the “Detention Book In Date” as the appropriate column for analysis and then count the number of unique book ins for each date. Grouping by date, this is what it would look like:
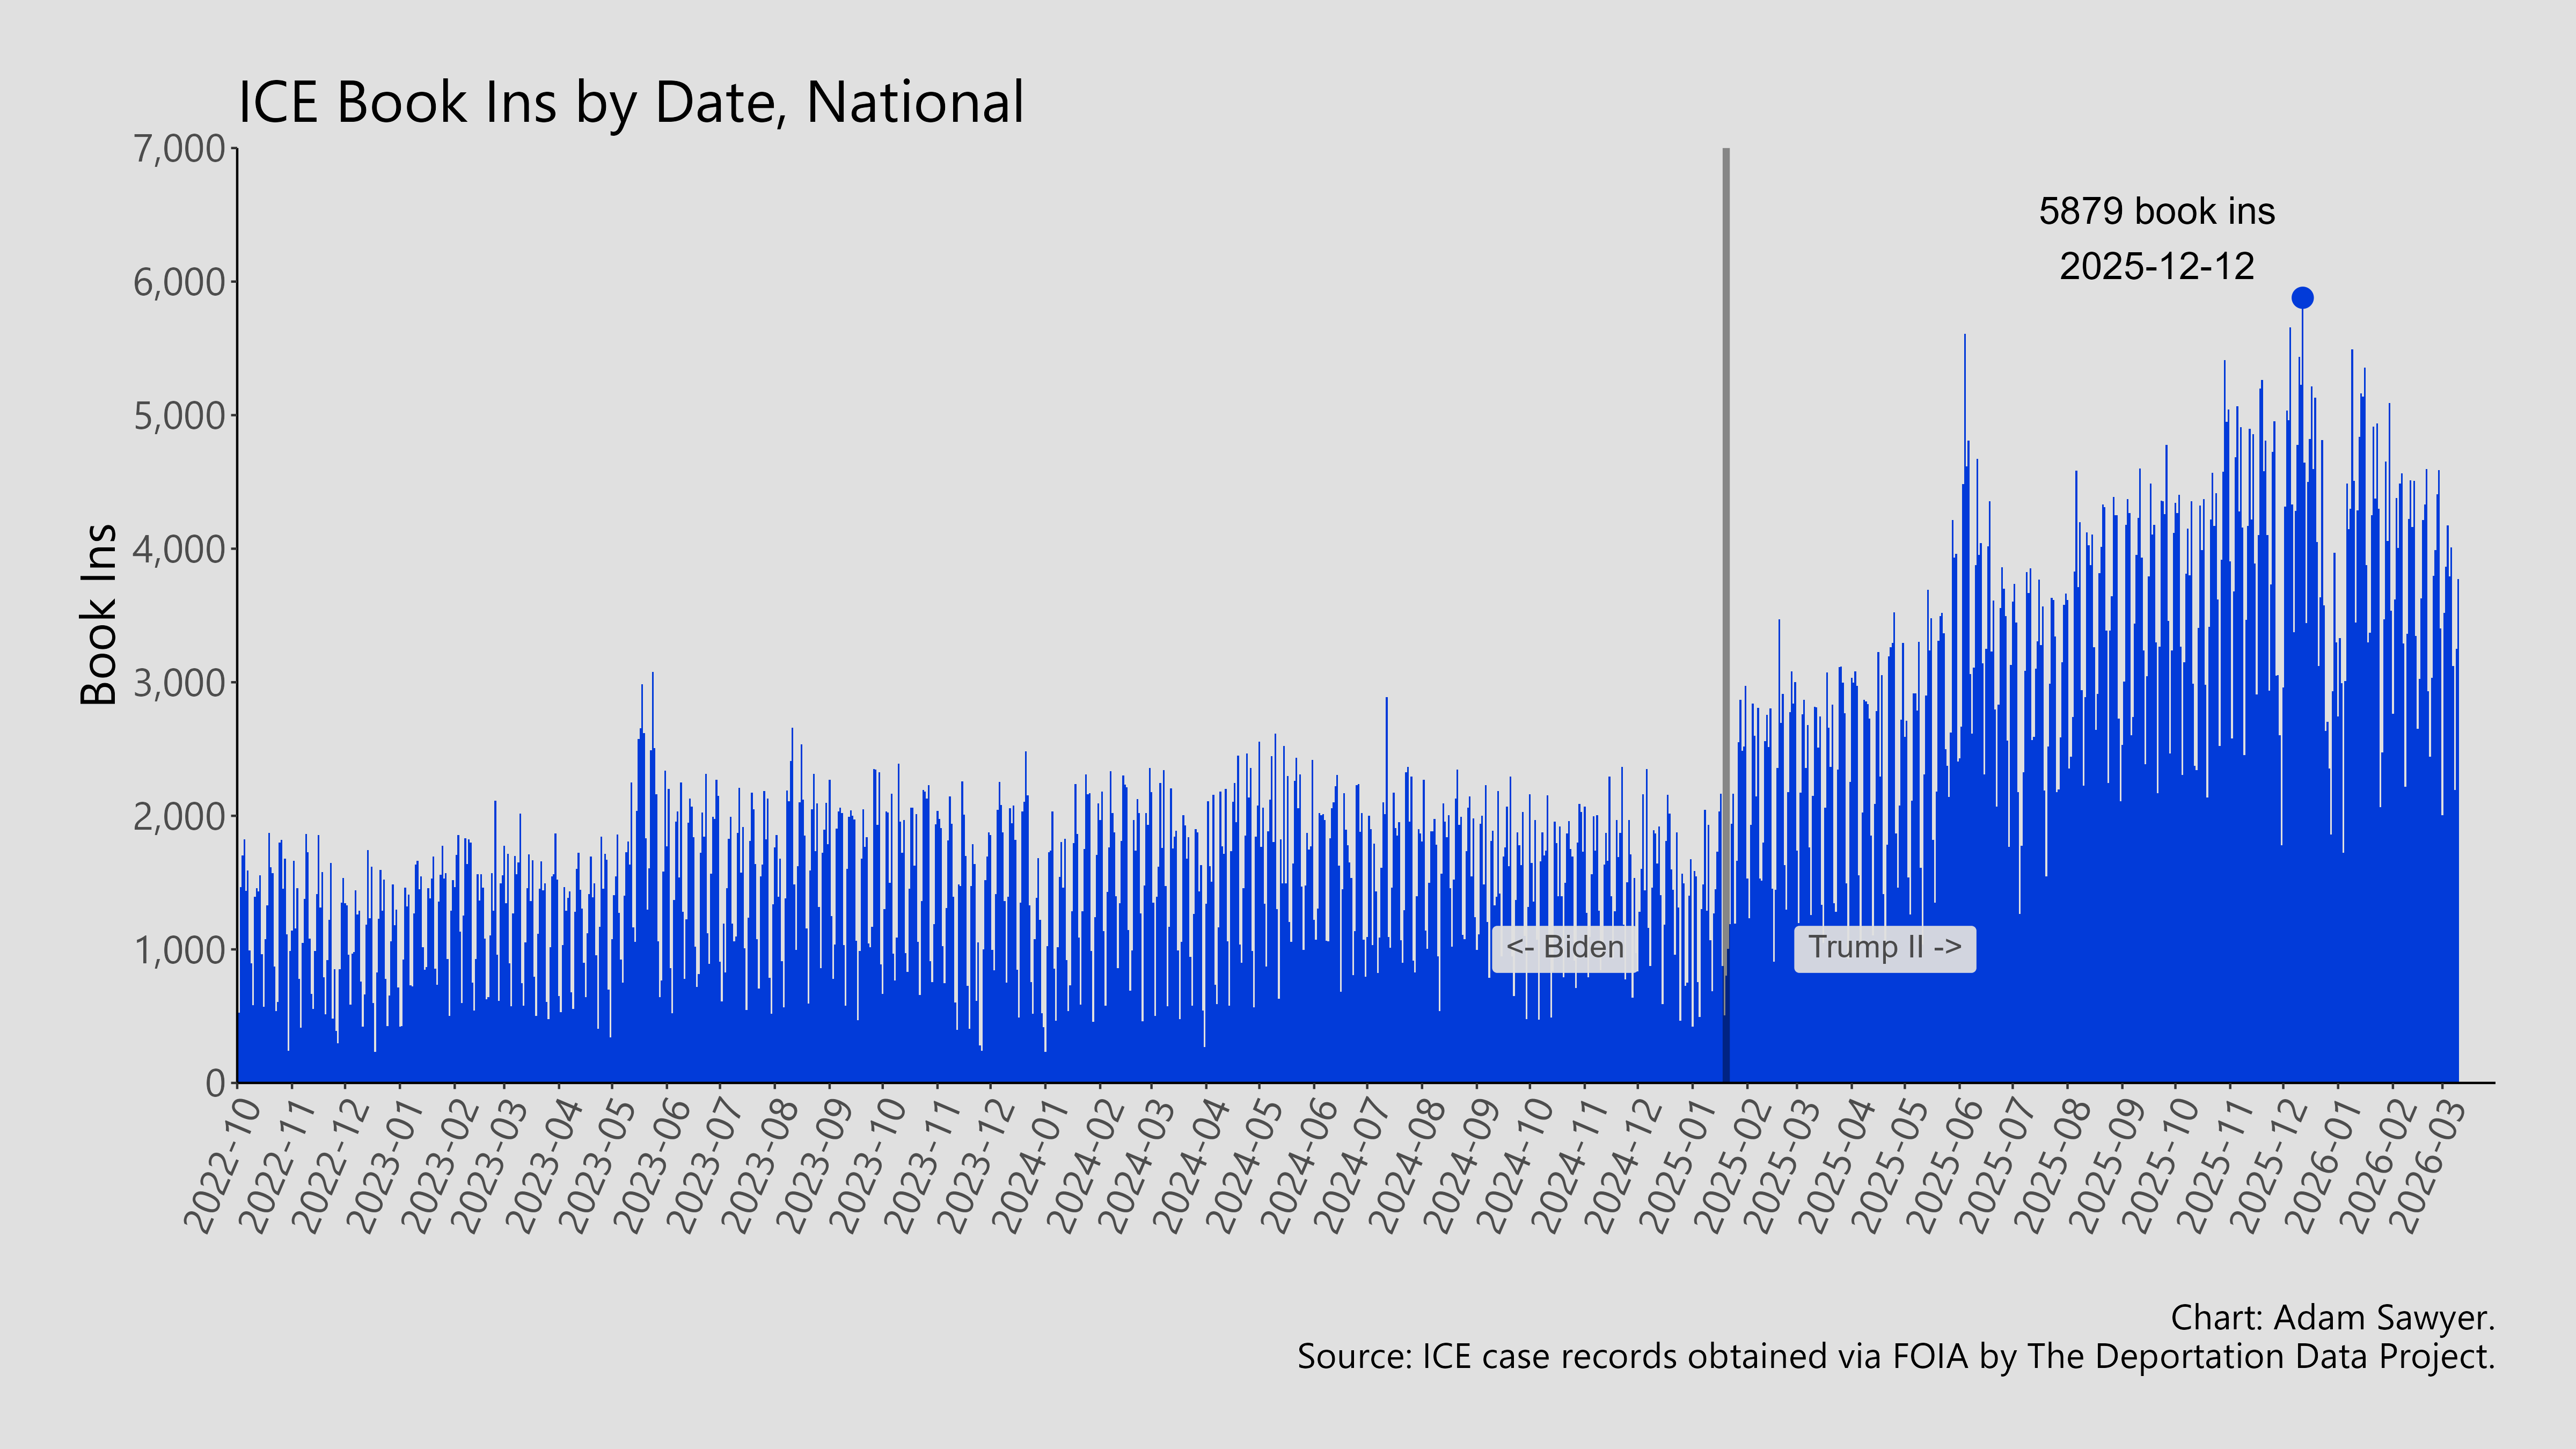
That’s the number of people brought into ICE detention each day. If we were looking for the total number of people detained at a given point in time, it might be different than what we expected. Even before the second Trump administration, ICE regularly detained 35,000 to 45,000 people on a nightly basis. Since January 2025, the number detained has nearly doubled. Yet this graph has a y-axis up to 7,000 book ins. Why is this?
Strictly speaking, the detentions data are really “ICE book ins” data.1 Each record represents the moment when ICE “books” someone into a detention center formally initiating the individual’s time in ICE custody. If one wants to know how many times ICE initiates a detention in a day, with the unit of observation being an event not a person, then it is perfectly acceptable to stop here.
But what if we want to know how many unique peopleare detained. How do we do that?
Unlike other kinds of ICE activities, a detention occurs over an interval of time. It can’t be time-stamped to a single moment, but starts at Detention Book In and ends at Detention Book Out. The Deportation Data Project provided us with a helpful term for this interval: a detention stint.2
We must find the date(s) a person is held between the book in and book out dates. This gives us the date range of the detention stint. Then, we aggregate. In other words, count the number of overlapping detention stints at every midnight to get a count of the detained population. I’ll get into the technical details as to how to do this below, but here’s what a detainee population graph looks like.
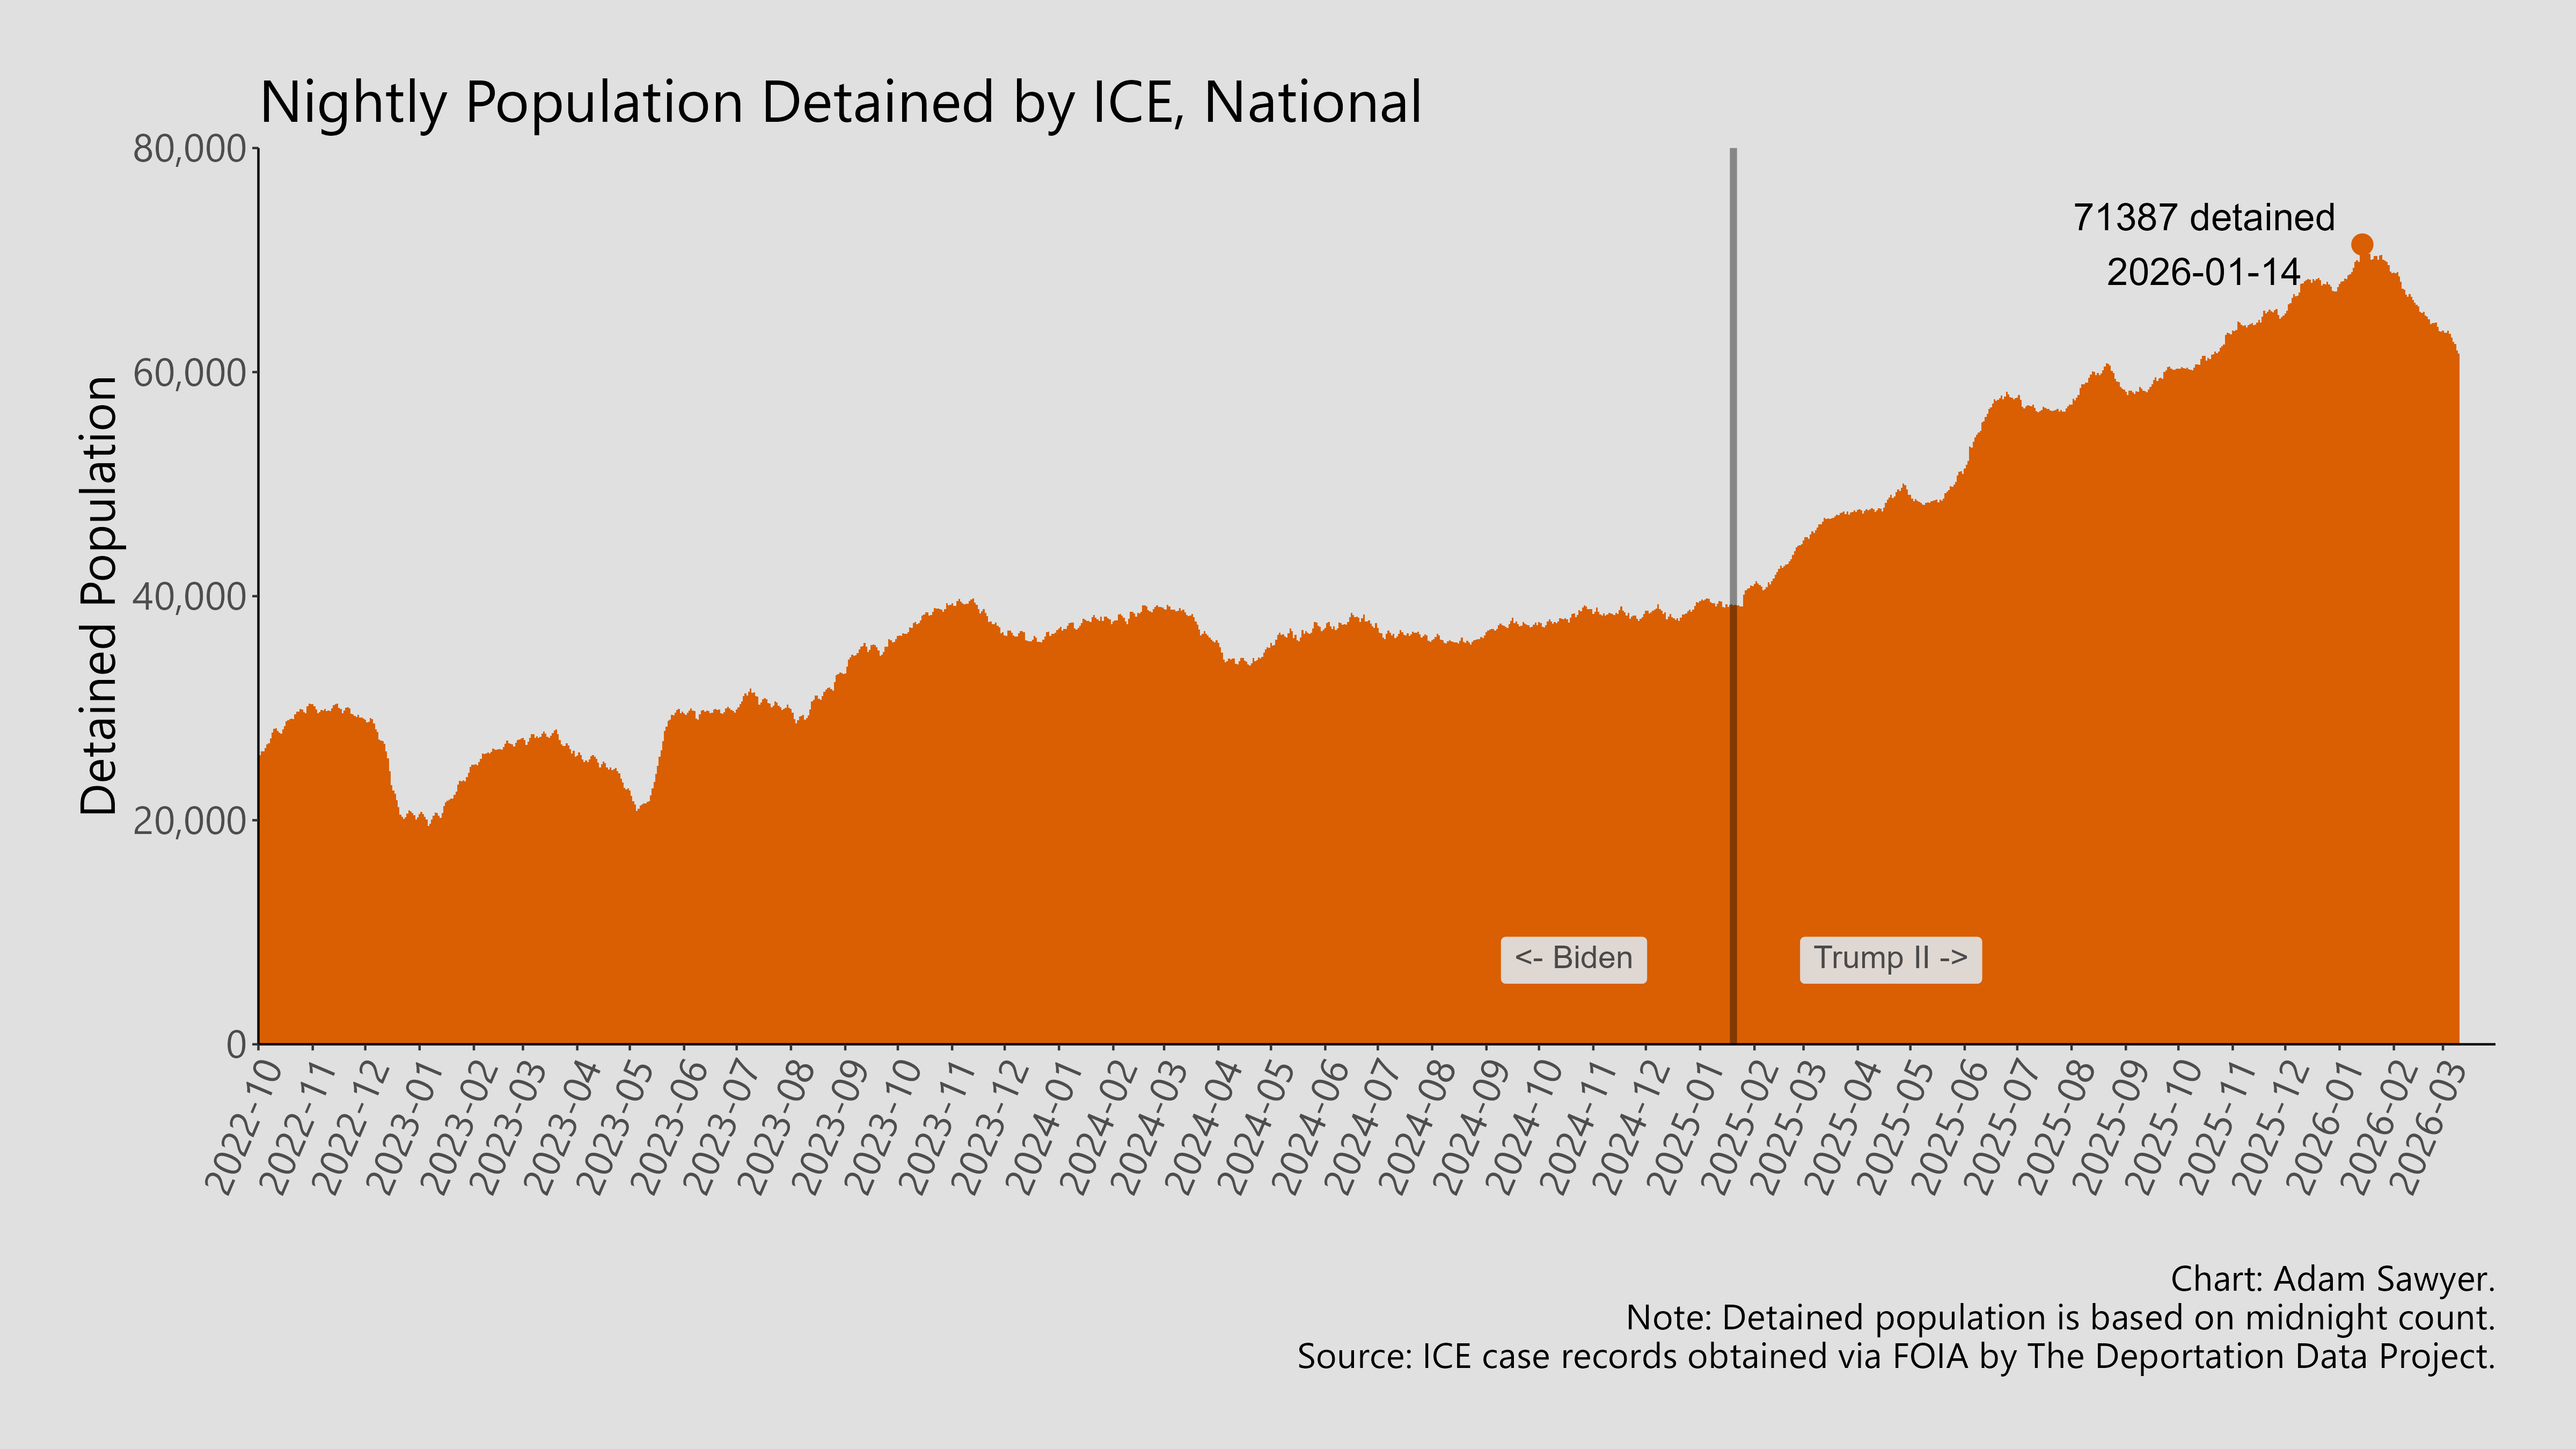 Sadly, that’s a lot closer to the number of people detained by ICE. We can validate this by looking at the agency’s semimonthly detention statistics updates.
This is the important point: Book ins provide the discrete, time-stamped event, much like arrests, detainers, and removals. One has to take the extra steps to convert the book ins dataset to one suitable to measure detention stints and stays. In the process, one shifts the unit of observation from an event to a person.
The second part of this post details how I did that.
How to Convert a Book Ins Dataset to a Detained Population Dataset
Step 1: Load the data onto your analysis platform
ICE sent the detentions data in a series of five xlsx files, each one including the book ins logged for a separate fiscal year from 2023 through 2026. In total, these sum to a total of 2.6 million records for the period of October 1, 2022 to March 10, 2026.
A lot of records!
I typically work in R, but a lot of people I know prefer Python. Whatever system you use, the first step is to load those 2.6 million records onto your data analysis platform of choice. This can take some time depending on the parameters of your computer.
Step 2: Cleaning
Initial processing involves stripping out the header material from each file and then, at least for my system, converting Excel numeric dates to the ISO-8601 formats suitable for analysis. I then stack the files into one dataset.
Step 3: Processing
This is a book ins dataset, but I wanted to be sure that every record did in fact have a Book In Date Time. This turned out to be the case. Every record included a book in date. Next, let’s check for double entries. ICE duplicates a book in record when a person’s bond amount changes. By removing the “Initial Bond” field, we can then run a de-duplication function to ensure that each record reflects a single book in event. For me, this meant removing less than a half percent of the 2.6 million records. It’s at this point that we could simply count the number of book ins. Here’s that same chart from above, just placed here again for context.
But that answers the question on the ICE side (How many times ICE commits a specific enforcement action?) but not the detained population side. Again, I want to know how many people were detained at a place every night at every location. For this, we need to find the time difference between two columns: Book In Date and Book Out Date.
The Book Out Date field requires a secondary step. Whenever the FOIA agent at ICE decided to extract the dataset for the FOIA production – sometime on March 11, 2026 – ICE was detaining more than 60,000 people. Those individuals will have no book out date. To tie off the facility population numbers in the dataset, I changed any NA book out date to “2026-03-10” the latest date with full data in the detentions data.
Step 4: Creating a Detention Stint Dataset
With book in and book out fields both cleaned and ready for analysis, we can calculate which particular calendar days – and importantly, nights – during which ICE held a person in detention. We can identify each unique individual based on the Anonymized Identifier field. It gives us the opportunity to count people, not just enforcement events.
Now, let’s create a facility population dataset.
There are different ways to do this next step. In my initial analyses back in October, I basically created a super long table and then calculated across dates and Anonymized ID.
But I now prefer the method used by Dr. Graeme Blaire compared to my initial method. Run a calculation based on this logic:
IF a) the date is on or after the Book In date AND b) the Book Out date is on or after the date + 1 day,
THEN the person was detained.
ELSE the person is NOT detained on that date.
Count up the unique Anonymized Identifiers for every facility and for every date. Sum those up and there’s your facility population at midnight, a standardized moment in time when we can determine a census of the number of people detained by ICE.
Step 5. Visualization
After trying to make a line chart work, I decided to go back to using bar charts. Each bar would represent a single day, so the bars end up looking like very thin vertical lines. Using Northwest ICE Processsing3 as an example, here’s how an early version looked:
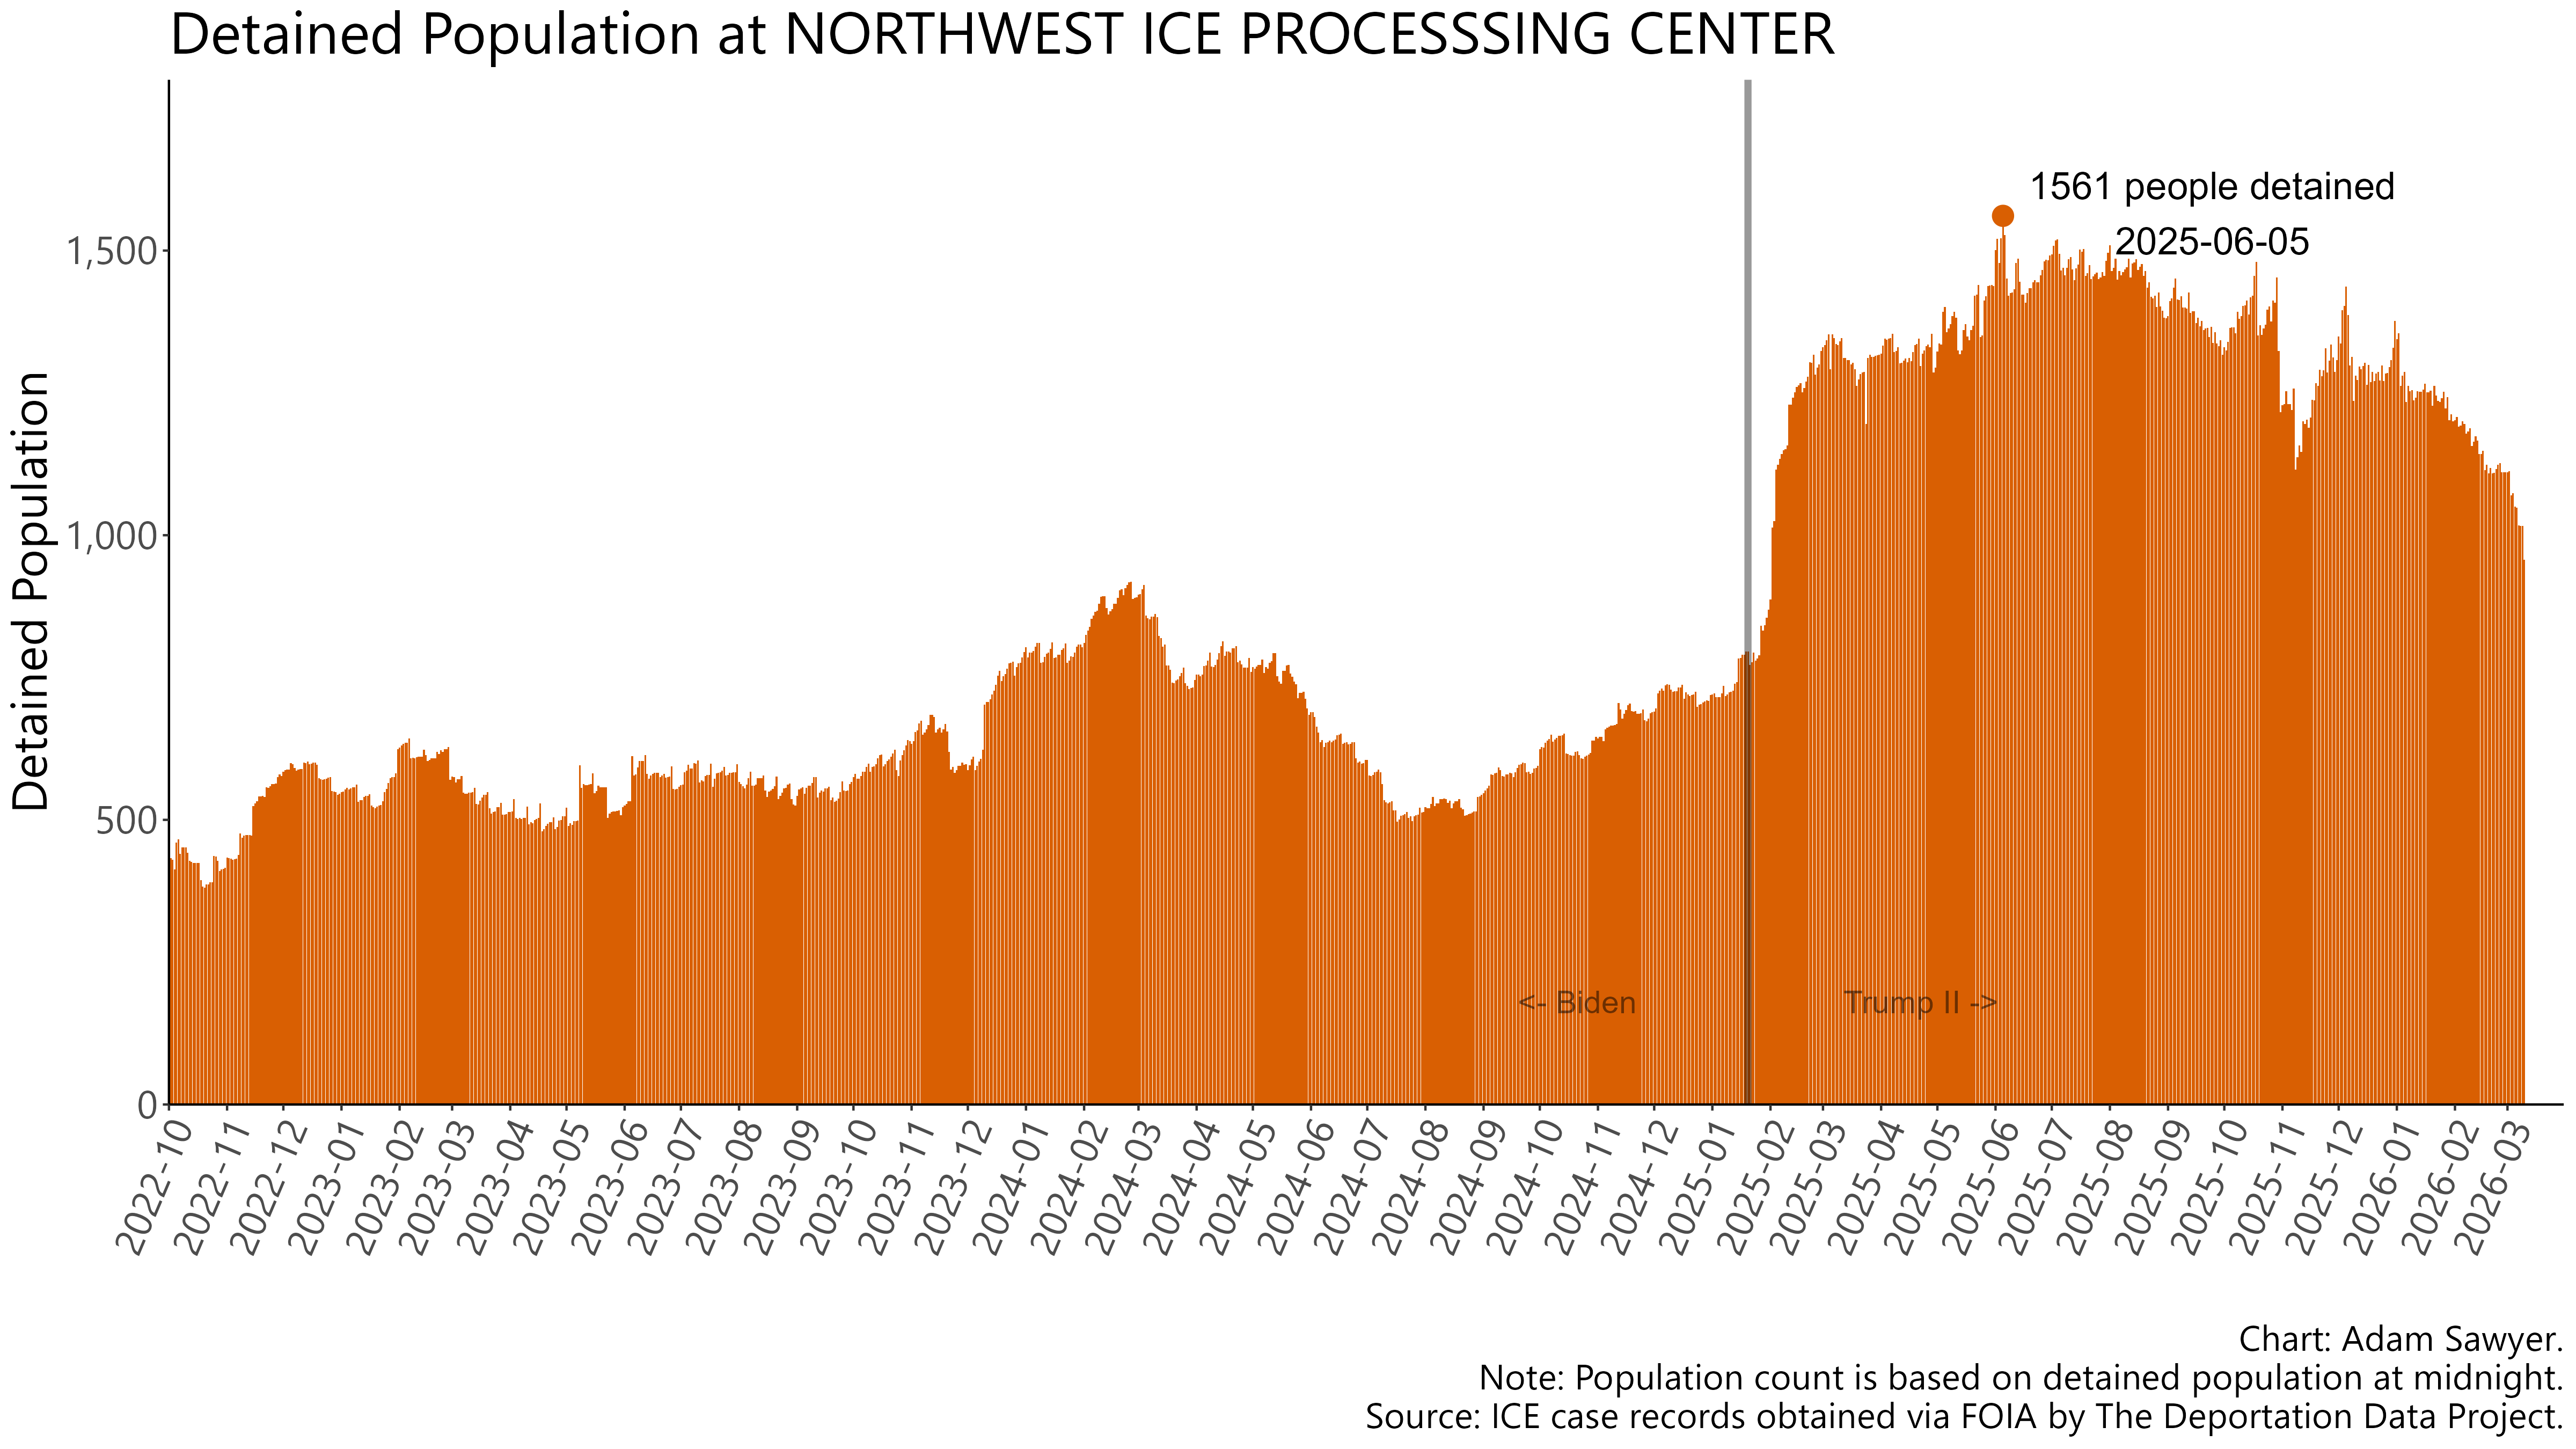
I fixed the banding issue by just turning off the border for every bar in each bar graph. I also played with the background color and converted it to an off-white instead of a bright white. I added a background to the administration labels and then made some adjustments to the captions. This was the result.
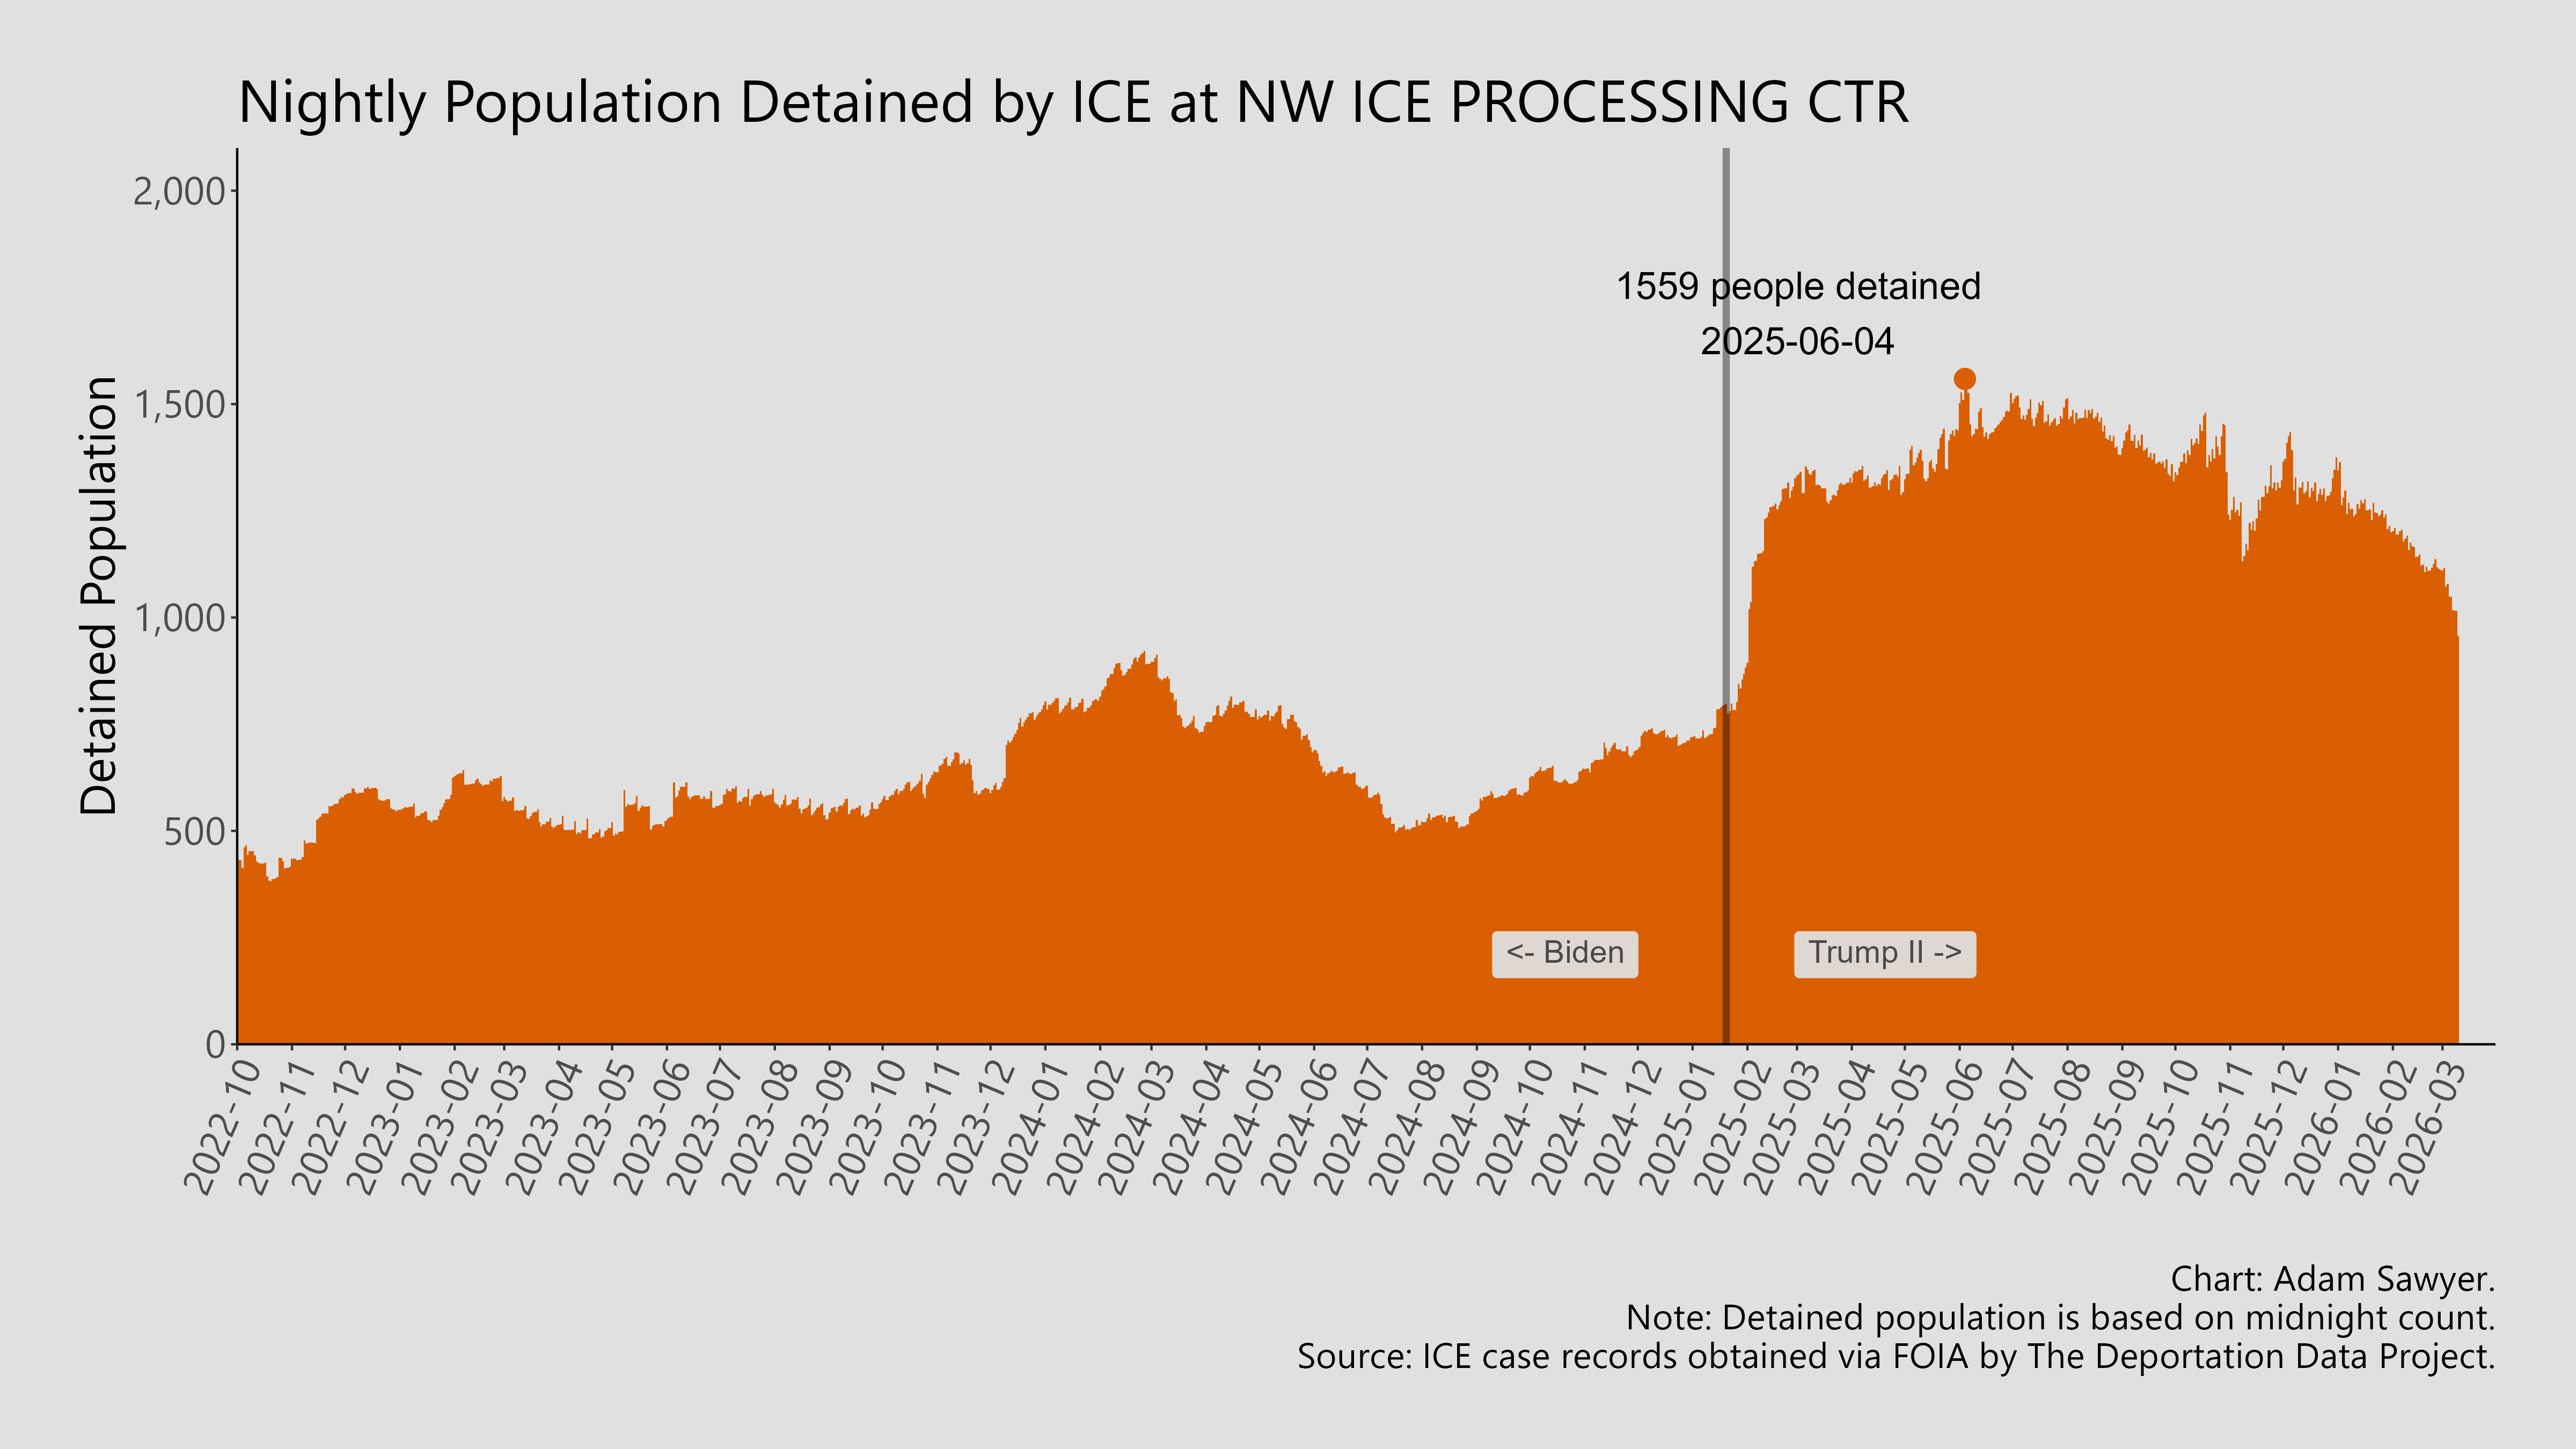
I made one of these for every facility using the detention facility codes, sometimes labeled DETLOCs in some ICE documentation. These are more stable than facility names. ICE has an unhelpful tendency to change facility names based on whims.
Step 6. Publishing
I put all of these on one Quarto markdown document and then pushed it to my personal website; a static website stored on Github and run through Netlify. I thought about dividing these into separate pages, but I wanted everything in one place with links to each facility chart. My initial images were a bit too weighty, so I reran the images at a lower resolution, which helped reduce the file size of each image from around 1000 kb to less than 500 kb. This helped the page load a bit quicker. It’s still a bit slow, but I was willing to trade this drawback for having one centralized location for all charts. I then posted a few samples on Bluesky. The book ins data contains fields that could that answer some substantive questions I’ve already received since publishing. Look out for more updates in the future.
Footnotes
For what it’s worth, we called it Book In data when I was at TRAC, too.↩︎
ICE often transfers people to different facilities while in custody. The Deportation Data Project calls consecutive detention stints a detention “stay.”↩︎
ICE really does spell the word processing this way for the Tacoma facility in the ICE documentation. I don’t know why.↩︎